Antibiotic Prescriptions that Deviate from Guidelines
Below is an overview of antibiotic prescribing that potentially deviate from national guidelines
Browse each plot below to find out more
How Many Antibiotic Prescriptions Deviate from Guidelines?
This plot analyses incidental prescribing only (i.e. the first time an infection-related READ code has been recorded in the patients EHR for three months, when just one READ code has been recorded during the consultation and, when one antibiotic prescription was issued for that consultation). The plot displays the raw consultation counts (y-axis) and the proportion of consultations where the prescriptions were in agreement with the prescribing guidelines (purple) and the proportion of consultations where the prescriptions deviate from the prescribing guidelines (blue), for each infectious condition. Analysis is based on the most recent first- and second- line recommended antibiotic treatment in national guidelines (NICE; PHE: GMMMG).
Antibiotics deviating from the guidelines (by infectious condition):
In this pie chart, you can filter the prescriptions issued by each infectious condition. The chart indicates which antibiotics were prescribed for each condition that deviate from the recommended guidelines. Data is a summation of incidental prescribing only (i.e. the first time an infection-related READ code has been recorded in the patients EHR for three months, when just one READ code has been recorded during the consultation and, when one antibiotic prescription was issued for that consultation). The analysis is based on the most recent first- and second- line recommended antibiotic treatment in national guidelines (NICE; PHE: GMMMG). Click the legend to see product names. Hover over a section of the chart to view the figure and percentage.
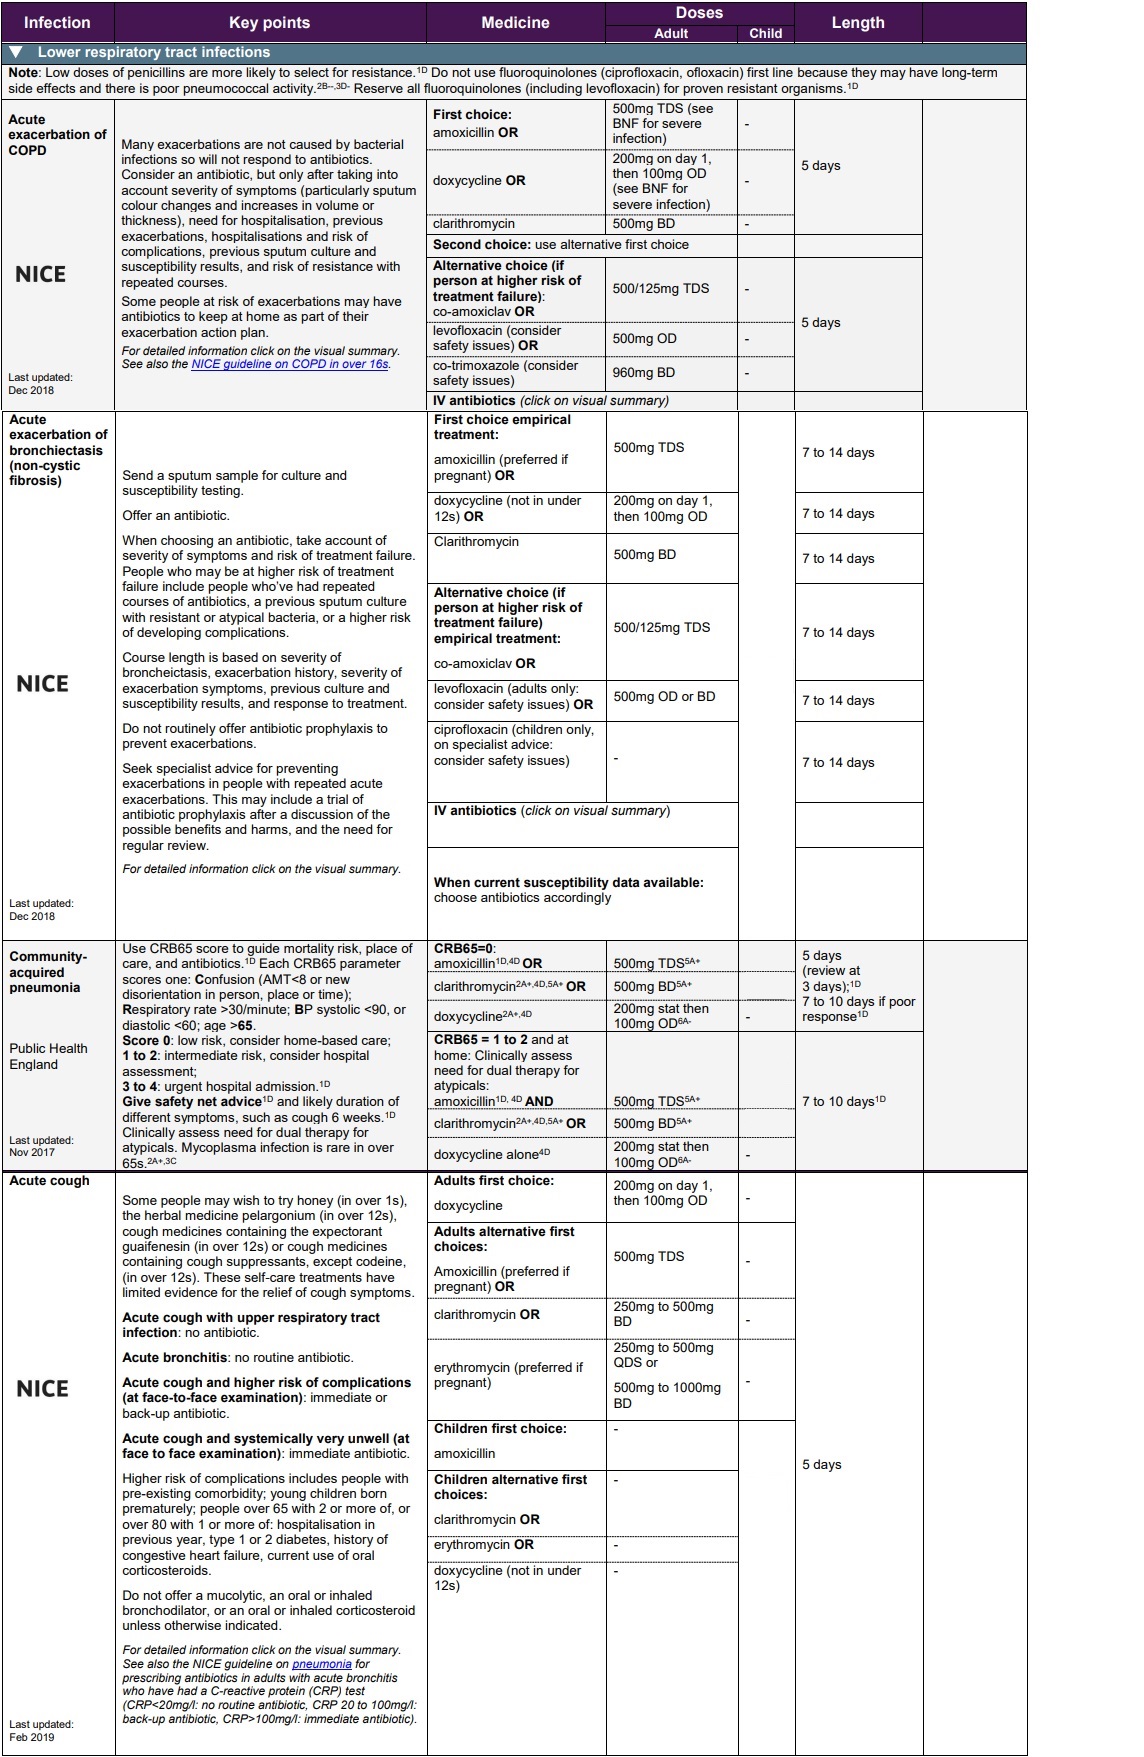
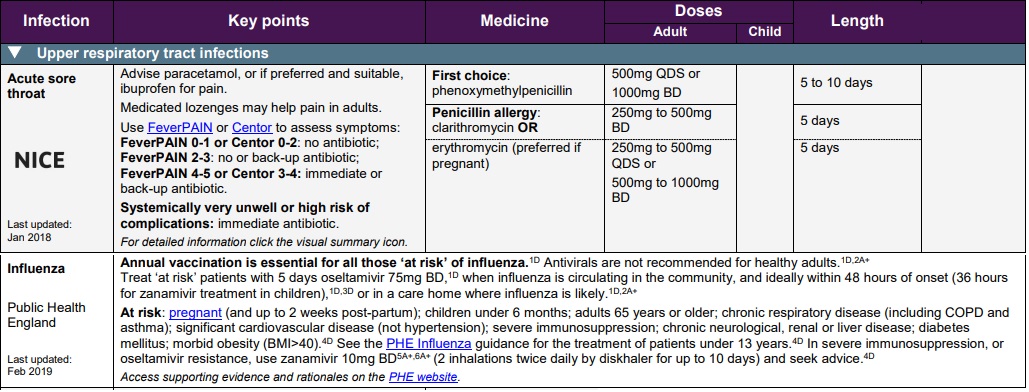
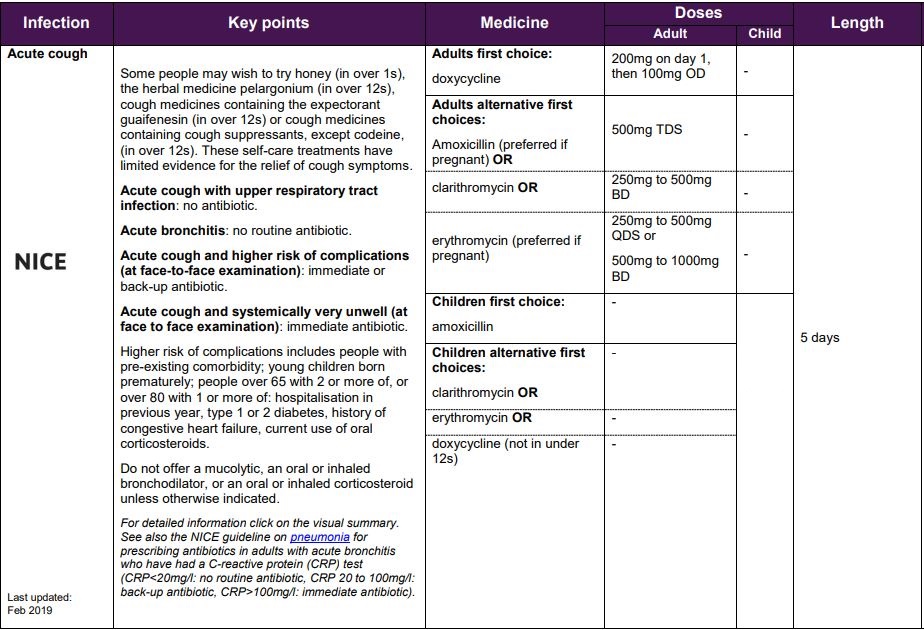
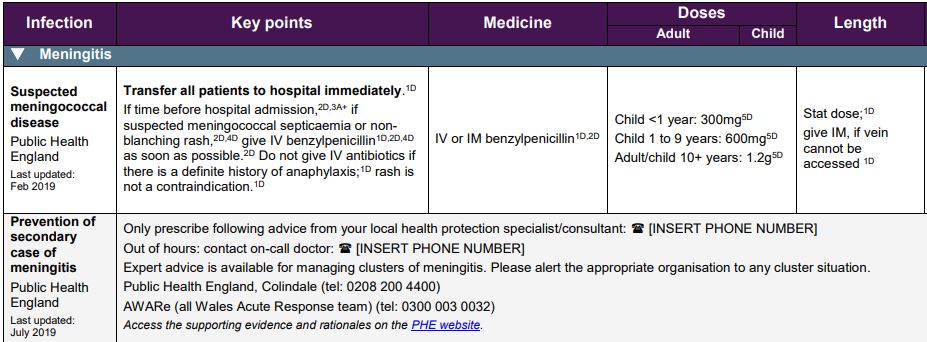
Prescribing Guidelines NICE 2019

The most recent set of prescribing guidelines by indication for Greater Manchester.


